With the v5.0 release just around the corner, I'd like to share some detail about the second major feature area we're introducing in this release (the first being support for JetBrains Rider).
We call it Runtime Data Inspection, or 'RDI' for short.
RDI is an analysis system. It could be called a debugger replacement, but I prefer to think of it as a different way of understanding code.
With a debugger, we step through our code usually one statement at a time. The tools allow us to inspect the contents of a process's memory at a specific point in time that we advance generally in a forward direction. If we step past a critical point, we usually need to restart the session to get back to it. The debugger is built around trying to understand a program while it is running.
RDI works on a different principle. When the code runs, NCrunch captures a wealth of data from its execution (such as variable values, parameters, fields, method control flow, etc). This data then gets stored in a compacted binary log that is written to disk as code executes. After the test has finished its run, this data is then available to NCrunch for analysis. We can then mine it to understand how the code behaved during its execution.
This isn't a new concept, as we've all been using logging systems since forever. What is new however, is the scale on which we do this with RDI, and the way in which we analyse the data.
The RDI Overlay
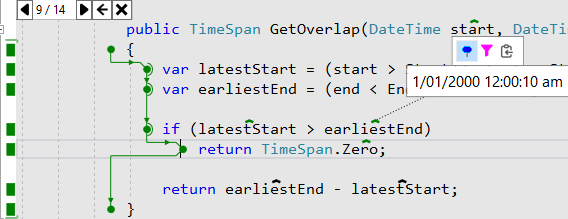
RDI presents captured data using an overlay that can be opened over your source code while the NCrunch engine is running.
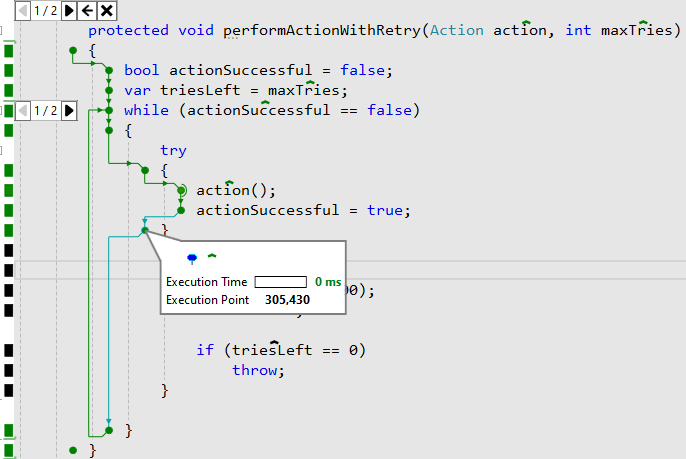
The system underneath the overlay extracts data relevant to the method you're working in, then restructures it and maps it to your code. RDI can then show the full path of execution through your code for any of the captured method calls, along with any performance bottlenecks, and the values of any variables, parameters, fields or methods that were accessed while the code ran.
Because a method can be called any number of times, the overlay lets you choose which of these frames you want to view. Subframes caused by loops can also be enumerated, so you can inspect the behaviour of every iteration of a loop.
Navigation
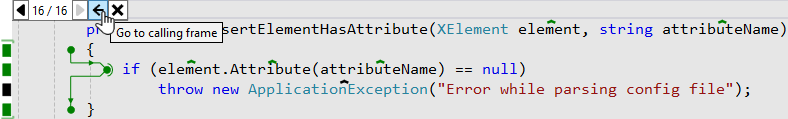
When using a debugger, navigation has always been restricted by program execution sequence. RDI knows no such boundaries. It's possible to navigate into any method call captured in the log.
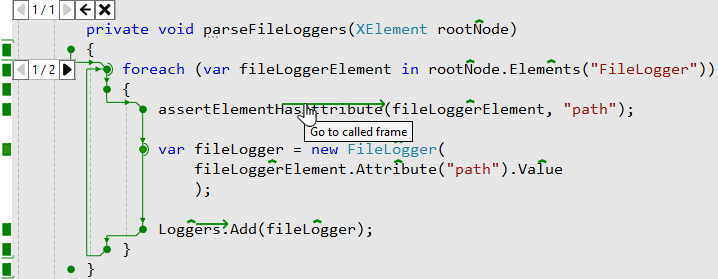
You can also navigate backward to the caller of the opened frame.
In this way, you can traverse your code any way you like. It's possible to work backward from a point of failure, then sideways into related code to find the true cause of the failure in an upstream component. Troubleshooting in this manner usually would require multiple debug sessions. With RDI, there's no need to wait for a debug session to start or for the code to run, because the binary log already contains the data we need. All we need to do is open the frame to show it.
Search and Filter
One of the best things about working with a dataset instead of a live process is the ability to sift through data. When using a debugger, we're heavily dependent on breakpoints to get us to the point of execution we're interested in. Sometimes this involves the use of conditional breakpoints, which can be remarkably fiddly, and in my experience have historically been somewhat unreliable. RDI's data sifting makes this so much easier. When the overlay is open, you can choose any data point to show all of the values that were captured for it.
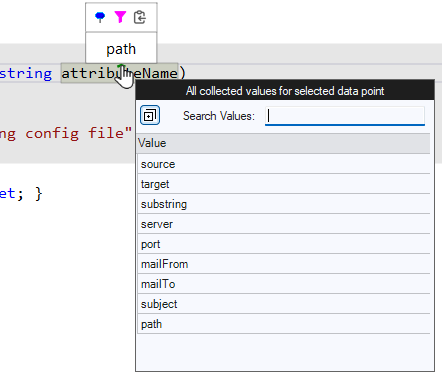
Double-clicking a value in the list will add a filter to the overlay, so it will only show frames that matched your chosen value when they hit the data point. Filters can be stacked, so you can slice your way down through the dataset.
Aggregations
While I expect most of RDI's use will be in understanding why a given test is failing, it can also aggregate data across multiple tests. It's possible to open a special aggregation overlay that will load frames from all the tests that cover a specific method. By clicking on a data point, you can then search and filter on all collected values for all covering tests that interacted with that data point. I've used this approach myself quite often when trying to understand how a given piece of code is being tested, then finding the tests responsible.
Aggregations open up some pretty exciting ways to troubleshoot problems with tests. One of my favourite ones is in dealing with sequence related test failures. For example, you might have a test that messes up something in the test environment that causes later tests to fail. In a big test suite, finding the test responsible for this can be very time consuming, but aggregations make it easy. All you need to do is aggregate the frames in the related code, and you can see what every test did with it.
Image Capture
RDI can capture and render image types too. You can pin these to the overlay while you work on the code producing them, so it can be like Live Reload for desktop development (without the need to save your code).
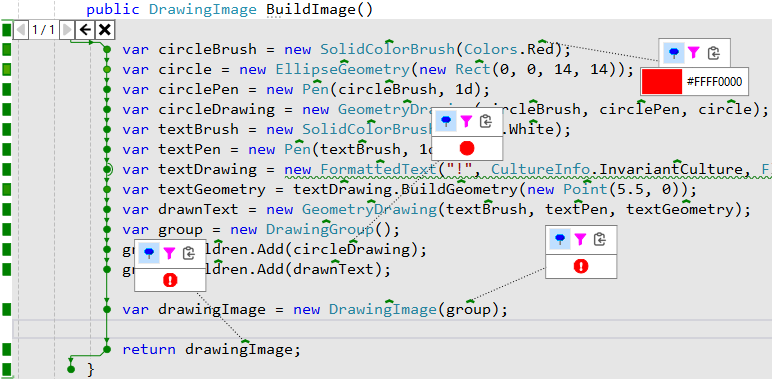
Right now we only support the capture and rendering of WPF elements that have an established render size, and there are some limitations around collecting these from grid nodes without a rendering GUI. This feature is still pretty experimental, but we want to do more in this area.
Other Features
Although RDI has a relatively compact UI and hopefully shouldn't be too hard to understand, there's a lot of work that's been done to make it as ready for the real world as we can make it.
Live Coding: All RDI overlays get updated dynamically from code as it changes. You can write code with the overlay open and watch how the data changes.
Fully Distributed: RDI is fully integrated with NCrunch's distributed processing. Logs are stored on the machine responsible for test execution. You can even aggregate test results across your entire grid.
Multi-Threaded and Multi-Process: RDI data collection won't go wrong when multiple threads are involved. The collection session can also span multiple processes if those processes are started from your test code. You can RDI entire process trees.
Async/Await: Handling this with RDI was hard, but we do it. If you have a method where the physical flow of execution is split using async/await, RDI will reconnect this and show it visually as a single frame.
Configurable: RDI is as configurable as the rest of NCrunch. There are dozens of settings and overrides to control how it behaves, so you can tune it to fit your unique needs.
Large Logs and Resource Consumption
Depending on how it's used, RDI can produce some pretty massive log sets. On the NCrunch solution with fairly aggressive collection settings, the logs for our 25k tests generally sit at around half a terabyte spread over our grid.
There is a clear cost associated with this in terms of both CPU and storage. Writing logs causes tests to consume more CPU and take longer to run. In our situation, it proved worthwhile to have a dedicated SSD set aside on each grid node just for RDI storage.
RDI uses a range of different limits to prevent overzealous collection of data. This prevents a situation where you might have a particularly loopy test that would otherwise capture 100GB of data by itself. Naturally, these limits are all configurable, so if you have the hardware available, it's possible to ramp things up and capture an insane amount of data. We haven't yet found the upper limit on what the engine can handle, so it should be interesting to see what people can do with it.
I'll add that I would consider the NCrunch solution to be fairly extreme in terms of both its number of tests and its coverage density. Most of our test solutions collect less than 5GB of data for a full test run using RDI, and this could be further reduced by setting the method data limit lower.
The Impact of RDI
As we dogfood everything we build, the first priority with RDI was always getting it to the point where we could use it ourselves. Given the clear challenges in building a system that can do what RDI can, and with the NCrunch solution becoming bigger and more complex by the day, this was no walk in the park. Using unstable software to fix unstable software can get pretty frustrating, but as RDI matured and started working properly, everything got very exciting.
It isn't easy for me to put a figure on how much more productive RDI has made us in working with code, but I think that a 50-100% increase is probably not an exaggeration. I have no idea what it will be like for other teams. I think the biggest boost we've had from RDI is when working with long running tests. A debug session on a test that takes 3 minutes to run isn't just a tedious wait - it's a full break in concentration span. Being able to just open an overlay and see what happened with a single click has really changed things for us.
Being able to see a rendering of WPF UIElements without needing to build and run a whole application has also been a game changer for us. All of the detailed RDI popup dialogs were built using this feature, and even though it can be a bit picky about render sizes, it has saved us a lot of time.
I can't wait to ship this and see what people think of it.
 Subscribe