It's a bit earlier that we'd originally planned to do another NCrunch release, but the release of .NET 4.8 and its dreaded DPI scaling issues left us with a few other things to clean up. We've also found an opportunity to include a couple of new features in this release.
Notable Fixes
v3.28 of NCrunch includes several fixes targeted at problems caused by VS2019's new 'Optimize rendering for screens with different pixel densities' feature. This feature builds atop .NET 4.8, which includes some very significant breaking changes to the way winforms controls render themselves onscreen. The extent of the breakage caused by this feature is so large that it's taken us a while to work through all the issues. Because all of the issues are concentrated in the UI, it's difficult to exhaustively test them using automation. Hopefully we're all on top of this now.
Another fix included in v3.28 is targeted towards the use of the VS debugger when resolving local variables and symbols under an NCrunch debug session. It's been found that we had an issue preventing this from working on source files making use of a type name redirection (i.e. 'using' clause in C#). If you put a type name redirection in the file, no symbols would resolve at all under NCrunch for any methods within the file. This has been broken since the release of the Roslyn compiler in VS2015, but has become much more prominent lately with productivity tools introducing more of these 'using' redirections automatically. I'd have liked to have pinned this down earlier, but it proved to be very elusive until early this week. The good news is that this problem is gone now.
New Tests Window Progress Bar
Last year we introduced a new horizontal pie graph on the NCrunch corner icon popup window. This has proven to be a very popular change.
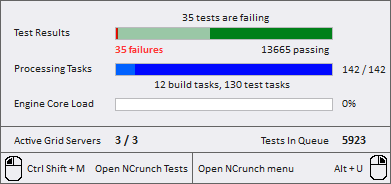
This little graph shows not just the rough percentage of the tests that are failing, it also shows the overall progress of the engine through the processing queue. Outside of the risk/progress bar (which has a few problems at the moment), this is the best way we've found to show progress of the engine and it's computationally very inexpensive to show.
So now we've elevated it so it shows on the Tests Window too!
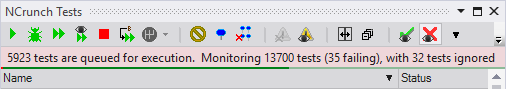
The little bar on the Tests Window is slightly different in that it shows progress from left to right rather than the other way around (which made more sense on the popup window). This bar gives you a great way to see at a glance the status of the engine without needing to shift your mouse to the corner of the screen.
Timeline Report Now Available Inside VS
Another very useful feature introduced last year is the HTML timeline report, which was targeted to users of the NCrunch Console Tool. The really neat thing about this report is that it gives you such an easy way to see what the engine is spending its time doing. It's also a great way to troubleshoot bottlenecks and find ways of optimising your test suite and NCrunch configuration.
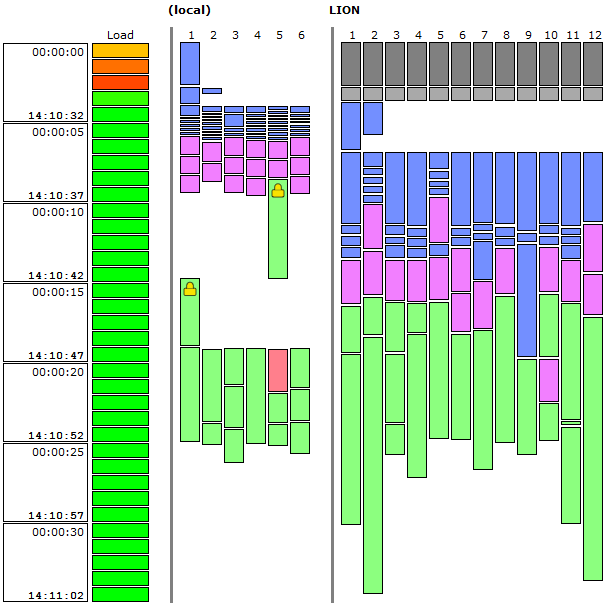
Because this is generally such an awesome report, it seems like a lost opportunity to have it only available for the console tool, so we've now introduced an option to export it from inside the VS session:
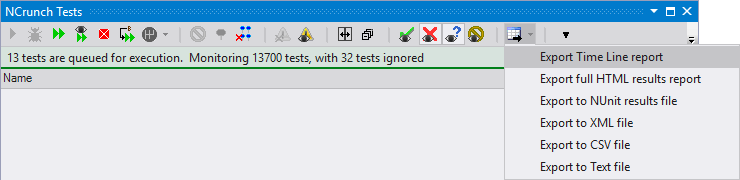
The adapted version of the report will show everything the engine has done in the last 10 minutes. We're looking at options to change this time window (perhaps depending on your last code change or run tests action), and would really value your feedback here.
Other Work In Progress
As previously mentioned, right now we're busy rebuilding NCrunch's entire instrumentation and CIL handling system from the ground up. This has been an ongoing project for a while, and is no small task. The old system was built on a 3rd party library and has become very difficult to maintain with recent platform changes being introduced. It's also responsible for the largest share of the delay between a code change being made and test results being reported, which makes it a natural target for optimisation.
We now have a working implementation that can successfully instrument assemblies at speeds that are an order of magnitude faster than the older system, and using only a tiny fraction of the amount of memory. Over the next few weeks we plan to extend this out to also handle NCrunch's IL-differencing features and QA it thoroughly to make sure it has the best chance of working in the real world.
We're very excited about the potential of the new system. Right now we're expecting it will give us:
- Better performance, resulting in drastic reductions in the time spent waiting for results after code changes are made
- Lower overall memory footprint, especially on machines with a large amount of concurrency working on large assemblies
- Better reliability, especially when resolving symbols inside debug sessions under VS
- Support for portable PDBs
- Room to implement some really cool new features
Anyway, v3.28 is now available for download.
 Subscribe