V3.18 of NCrunch is an incremental feature release including some nice UI and performance upgrades, along with some crucial improvements to the NCrunch Console Tool.
We've also included another round of compatibility fixes to maintain support for the ever growing list of platforms NCrunch is built on.
Console Tool Improvements
As with the other releases we've put out this year, the NCrunch Console Tool is a big winner for this release. This tool was originally intended to be a simple headless version of NCrunch that could be run within a CI, but over time it's become quite clear that the CI use case is quite different to that of the NCrunch VS plugin.
When using NCrunch under VS, the focus is almost always on trying to get the most relevant results returned to the user as quickly as possible. Under a CI system, we're far more concerned with reducing the overall execution time of the build system than we are with returning relevant results early.
The reporting needs of a CI system are also vastly different from a continuous testing scenario. Under VS, we want to report information as much as possible in real time. Under the CI, we're generally more concerned about the behaviour of the run as a whole. This difference is well represented with the sorts of support requests we get for each of these use cases. Console tool users can sometimes be confused about why some runs take longer than they expect, and until now we haven't been well equipped to explain this. The only real output we've had to help us understand this, the trace logs, are a massive jumble of activity that can be very hard to untangle to see the big picture.
And so, we now have the NCrunch Timeline Report.
The timeline report is deposited automatically with the other artifacts that are output from an NCrunch Console Tool run. It's a very pretty report, and it gives an amazing amount of information about the run from a simple glance.
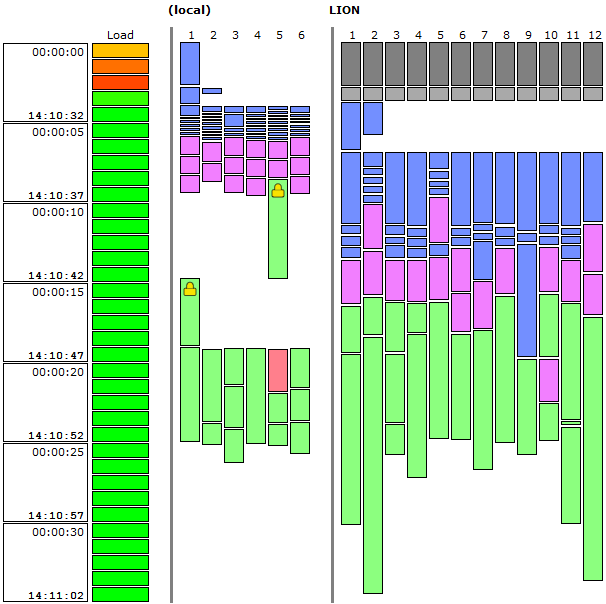
Under this report, tasks are stacked vertically over time over horizontal lanes that each represent a task processing thread in the available grid.
In the above scenario, the console tool was used to execute a run over a moderate sized solution using the local processor and a remote grid node ('Lion'). The local processor is a much newer, faster processor but has less processing threads available than the slower remote node.
In this report, build tasks are shown in blue. Analysis tasks (for discovering tests) are purple. Passing test tasks are green and failing test tasks are red. You can also see some grey bars at the top of the report under the grid node showing the time it was offline while the client was still initialising and connecting to the server. It will also be visible in the report when the grid node is doing work for other grid clients.
Noticeable elements here include the yellow lock icons on some of the locally executed tests. These tests have been marked with NCrunch's SerialAttribute, preventing them from being run concurrently with other tests. Not shown in this screenshot are symbols indicating other concurrency control (ExclusivelyUsesAttribute, InclusivelyUsesAttribute). The goal of this report is to always make it visible where the bottlenecks are in your run.
The mostly green blocks down the left side of the report give an indication of 'Engine Core Load' throughout the run. This is our relatively new metric for reporting how heavily loaded the NCrunch orchestration thread is at any point in time. It's normal for engine core load to hit 100% during the first parts of any run while the engine is bootstrapping itself. Our testing suggests that the engine in its current form can usually handle well over 100 concurrent processing threads before core load starts to become a problem, though this is naturally hardware and scenario dependent.
The report is also interactive, allowing you to mouse over the elements to see what they are (sorry, the screenshot won't do this).
If you're working under Team City, it's possible to adjust your TC configuration so that the timeline report is available in your TC build results without needing to navigate through the artifacts.
As a developer on the NCrunch project, I can say that the timeline report is one of my favourite features. It so brilliantly shows the workings of the engine over a run in a way that is both easy to understand and visually impressive. For years the engine has been a bit of a black box where we only see the results coming out, but now we can really see what it does in a way that really makes the parallel execution and distributed processing features shine.
We're presently looking at ways to enable this report inside the VS plugin for selected periods of execution. I'm hopeful that we can find a tidy way to do this despite the life cycle differences between the VS plugin and console tool.
Tests Window Toolbar Improvements
NCrunch's Tests Window has come to be seen as the face of NCrunch, and it's easily the most heavily used of the available UI windows. So it isn't really a surprise that we've had no shortage of requests for ways to customise it, or to add new buttons. The biggest problem we've faced here is that many people use the Tests Window in situations where there is very limited horizontal space. This means we can't just keep cramming more buttons on the end of the toolbar and hoping it will look good for everyone. So now with V3.18 it's possible to customise the toolbar!
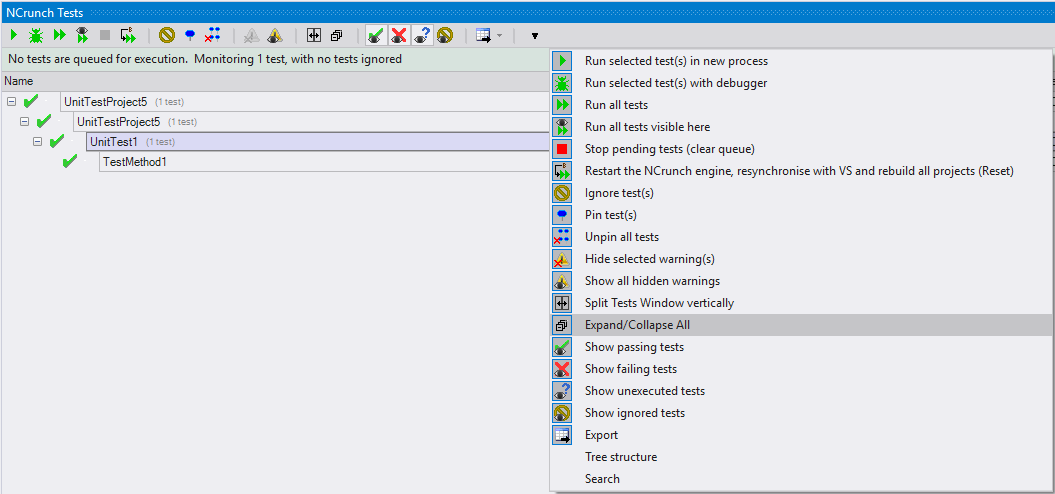
Now we have a tidy little arrow option on the far right of the bar, enabling access to a dropdown menu where you can choose which options you want on the toolbar. So now you can just turn off the options that you never use, and save yourself some horizontal space.
Because space is no longer a serious issue here, we can now finally add new options, like the much requested Expand/Collapse All button!
Other Improvements
The introduction of the timeline report and our subsequent dogfooding has led us to discover several deficiencies in NCrunch's grid processing that were limiting performance in some scenarios. So we've also addressed these in V3.18.
We've added a new configuration setting allowing you to override properties inside your build system, without needing to modify your project files.
V3.18 also includes a fresh round of compatibility updates to keep NCrunch working right with the evolving eco-system. In every way this should be the fastest and most stable release of NCrunch yet.
Check out the full list of changes in this release, and go grab it now!
 Subscribe