It gives me huge pleasure to announce the much anticipated release of NCrunch V4. This release has been the goal of more than a year of focused development.
When measured by the scope of internal changes, this is the most significant release of NCrunch since its first public build back in mid 2011.
NCrunch V4 contains two major areas of improvement. One of these is in the internal performance of the tool. The other is in a big new feature area intended to help you with your own performance optimisation.
Highlights
I'm going to go into an unusual amount of detail in this blog post about what we've done in V4 and the results of the changes. If you're not interested in the detail and you just want to get started with the new release, here are the highlights:
- We've completely rebuilt the entire instrumentation and IL manipulation subsystem to improve compatibility and performance. Post-build assembly processing performance has been improved by an astonishing average of 626% and full test cycle times have been reduced by an average of more than 30%.
- To get these benefits you'll need to switch your 'Instrumentation Mode' configuration setting to 'Optimised'. We're running the new system in parallel with the old one until it's cleared beta and we're certain there are no regressions hidden in there. This means you should use the optimised mode if it works for you, and you have the option to switch back to the old legacy mode if it doesn't. Please make sure you report any problems you find with the optimised mode, as we do eventually intend on removing the legacy option entirely.
- We've added major extensions to the UI to allow sifting of line-by-line performance results on a per-test or global basis. This means that the performance data we've been passively collecting while we run tests is now much easier to search through and find bottlenecks in your code. You can find this under the new 'Hot Spots' view inside the NCrunch VS menu, and under the new 'Hot Spots' tab in the Tests Window.
Background
The adaptation of NCrunch to work with .NET Core included many surprises. One of these was Microsoft's introduction of a new portable PDB format to replace the old legacy Win32 PDB files used by .NET since its first introduction. In some ways, this is unsurprising as the old Win32 PDB files are notoriously bloated and difficult to work with.
Although the new portable PDBs are undoubtedly a massive improvement for .NET as a whole, they did create some new challenges for NCrunch in being able to interpret the debug data while processing assemblies. For the duration of its life, NCrunch has been reliant on an old fork of an open source IL manipulation library called Mono.Cecil. At the time this fork was created, Git was still a new and exciting thing that people were trying to find excuses to use, and SVN was very much set the standard for VCS systems. The lack of efficient options for keeping our fork updated resulted in it deteriorating significantly over the years. By the time the portable PDB came along, it was no longer feasible for us to merge Mono.Cecil's newly developed portable PDB support over to our deteriorated fork.
Compounding this problem was our own desire to further improve the performance of NCrunch. A decade of playing 'squash the bottleneck' meant that there were no quick wins left to improve the speed of the product. The IL manipulation step performed by NCrunch is critical to most of its features. Unfortunately, it was also our single biggest hog in terms of CPU consumption and test cycle delay.
Furthermore, we have some very big plans for new feature areas to explore with NCrunch. Most of the ideas for these features involve more complex manipulation of assemblies, which would only involve stacking more code on a subsystem badly in need of attention. It was apparent that anything we built on the old subsystem would eventually need to be rewritten. Unplugging from Mono.Cecil and replacing it with a more specialised system became an urgent project.
A New IL Manipulation System
NCrunch's processing of assemblies is a big deal. We do this for the following reasons:
- To add instrumentation to method code, so we know which lines of code are covered by tests
- To identify which assemblies have had their surface (i.e. public) signature change, so we know when to build projects that depend on them
- To track the internal changes within assemblies, so we know which tests are impacted by these changes
- To rewrite assembly debug data so that it points at the foreground solution, instead of the background workspace where the code was actually built. This is done so that you can debug your code using NCrunch
- To discover the entry points of tests in the project (i.e. method source line numbers)
- To discover tests when using test frameworks with adapters that support static analysis
Replacing Mono.Cecil also meant replacing the areas of NCrunch responsible for all the above. This meant we had to not just build an entirely new IL manipulation system from scratch, but also rebuild around 20-30% of NCrunch. Given that the ECMA-335 specification for .NET DLLs/EXEs is nearly 600 pages long, this has been a very large task. We've been fortunate that the teams in Microsoft have recently slowed down in their release of breaking changes to the .NET Core platform. If this hadn't been the case, there's no way we could have achieved such a large task while keeping NCrunch updated.
The good news here is that because we've been rewriting code, we've been able to redesign it with a focus on the single most important goal: Performance.
By introducing our own IL manipulation system for only our use, we've been able to optimise it for just the key things that NCrunch needs and nothing else. We were able to design the system alongside the old one to ensure it would outperform the original in every area we needed it. With attention to allocation patterns and compact indexing, the new manipulation library has been able to directly exceed the performance of the original by over 280%.
Interestingly, we also saw a decrease in overall instrumentation memory consumption of over 90%, which allowed us to bring the manipulation system out of the nCrunch.BuildHost processes and up into the engine itself. This in turn cut away the overhead of transferring a large amount of data from nCrunch.BuildHost into the engine, further improving performance. It also allowed us to introduce centralised caching between all build tasks, improving performance even further. Because the new manipulation system is also thread-safe, we've been able to divert excess capacity from the Processing Queue to perform the manipulation tasks in parallel.
The Results
Capturing useful generic information on NCrunch's performance is a difficult thing to do. Because we support so many platforms, configurations and test frameworks, it's hard to find a 'typical' solution to report metrics from, if such a thing actually exists.
Assuming a good candidate solution can be found, there is then the problem of its chosen use of test framework. Different test frameworks have different performance characteristics. For example, when running MSpec under NCrunch, we perform test discovery statically while we instrument the test assembly. For NUnit V3, we do this by building a runtime environment and asking the test framework to provide the list of tests. Each framework is different, and some do better than others. A sample solution needs to not only be of sensible size and scope, it also needs to be able to be adapted to all test frameworks supported by NCrunch, without any odd or intermittent behaviour.
Eventually, we settled on generating a test solution. Since the generation could be parameterised, we could use the same structure for all supported test frameworks. There are definite drawbacks to using a generated solution for performance testing; particularly around trying to build a realistic project structure. To make sure the results weren't all skewed, we did compare them with some other test solutions we use internally and tweaked the generation system until we had something we could rely on.
The generated test project we used for our testing is a .NET Framework 4.8 project containing 13,200 lines of code and 400 tests. The testing was performed on a high-end machine running on an i9-7980XE CPU overclocked to 3.9GHz, ample RAM and a Samsung SSD/NVME 970 EVO. To try to account for small variations in timings we ran the full test system 11 times and took an average of the results. The results were extracted from the second cycle of the engine to prevent distortion caused by once-off tasks that only happen on the first cycle. Our second cycle consists of a rebuild of the test project and a targeted run of a single test inside it. The tests in this project all have a near zero execution time.
To get an idea of how the new system has improved performance for different parts of the engine, I've broken down the results into the major tasks the engine needs to complete to return a test result after a source file has been changed. The details of these activities are also accessible for you under the 'Execution Steps' tab in the NCrunch Tests Window.
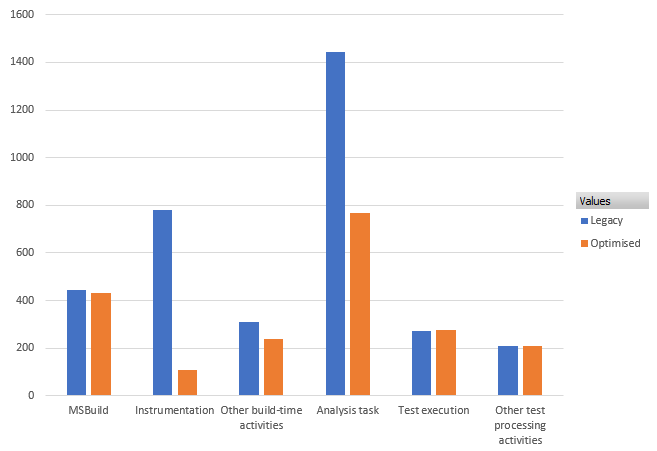
Time taken by each major task performed by NCrunch over a targeted cycle (ms)
We're very happy with the results here. A few points of interest:
- The figures in this chart were averaged across all supported test frameworks
- The 'MSBuild', 'Test execution' and 'Other test processing activities' tasks were unaffected by the new system, as none of these tasks are connected to it. Small changes in these tasks are just statistical variations between repeated runs.
- The 'Instrumentation' task actually represents all of our post-build processing of the output assembly (including test discovery). Across all frameworks, this task now runs on average 626% faster than the original.
- The 'Analysis' task is a test discovery step we use for test frameworks with adapters that don't support static analysis (NUnit3 and XUnit2), and for frameworks that are configured to run using dynamic analysis instead. Because a large part of this task also involves the handling of NCrunch's special attributes using the IL reader (i.e. ExclusivelyUsesAttribute, IsolatedAttribute, etc), we saw a massive (88%) improvement in its performance
- 'Other build-time activities' includes the overhead of IPC communication with nCrunch.BuildHost, which has been largely negated by the new system. It also includes workspace creation, which is quite expensive and wouldn't happen after the engine has completed a few cycles. The effect of workspace creation means the timings for this cycle are reported as higher than would be normal once the engine has been working for a while.
The use of the generated test solution has also enabled us to do something we've never done before: Report performance metrics by test framework.
DISCLAIMER: Before reading too much into this data, please consider that these tests are measuring the performance of the adapters we develop to interact with the test frameworks as much as the frameworks themselves. This is not a direct measurement of the performance of one test framework against another. There is also likely to be considerable variation in test framework performance depending on the structure of the tests involved, and we aren't testing the speed of any of their more advanced features. If you were to test the performance of NUnit vs Xunit using a different runner (i.e VSTest) you may receive very different results to those below. You should not consider these metrics in any way accurate for your situation unless you are using NCrunch exclusively.
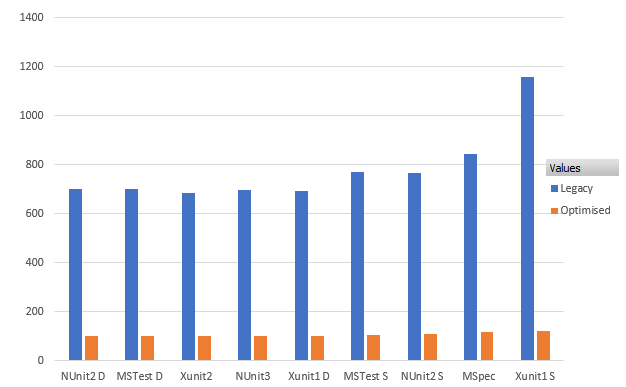
Time taken to perform IL-based processing by test framework (ms)
The above chart shows the time taken by the NCrunch engine to perform its IL-based processing on an assembly during a build task. More than any other chart, this shows the massive improvement in performance under the new system. The metrics on this chart also include test discovery times for frameworks using static analysis (marked with an 'S' suffix). XUnit2, NUnit3 and frameworks with a 'D' suffix instead perform discovery using a runtime domain, so their times are the same because they don't do anything unique here.
Of particular note is the improvement in performance of Xunit v1 under static analysis. Our measurements put this at a stunning 841% improvement over the legacy mode. Xunit v1 is handled using an old Gallio based adapter that responded extremely well to the new system. Sadly, this framework doesn't get used much any more, but it's still nice to see old code getting better.
Now let's take a look at how the new system has improved the responsiveness of the engine overall.
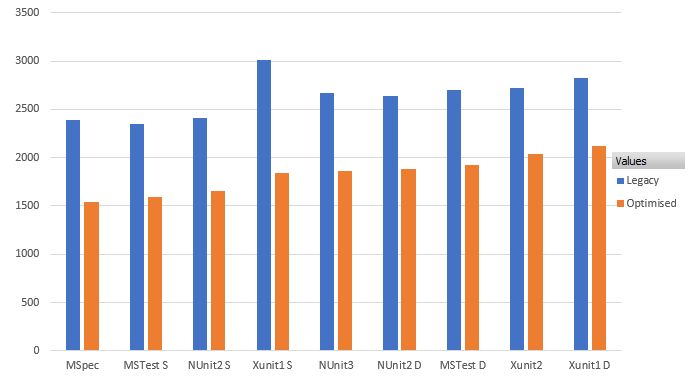
Targeted engine cycle times by test framework (ms)
The above chart shows the time taken for a full targeted cycle of the NCrunch engine. In other words, if you were to make a change to a test in the sample test project code, this is how long the engine would take to return a result from the changed test.
A few points of interest:
- MSpec presently appears to be our fastest framework in the tested scenario. This is likely owed to the simplicity of this framework and the ease of our integration with it. Because we only use it through static analysis, it stood to benefit much from the new system.
- This is closely followed by MSTest when set to use static analysis. Note that although we call this framework MSTest, it is actually an internally developed emulator intended to behave similar to MSTest. We don't integrate with the MS components under this framework. We took some hits in compatibility with the emulator but it also gave us the chance for ample performance tuning.
- Our worst performing framework is Xunit v1 when set to dynamic analysis. The old Gallio adapter used for this framework was optimised for static analysis many years ago and dynamic analysis was only provided as a fallback option.
- Again, the biggest overall improvement came under Xunit v1 in static analysis. This framework fell from 3012ms to 1839ms - an improvement of 64%!
- The average rate of overall improvement is 44%, with a reduction of 2634ms down to 1828ms. So we've knocked an average of about 800ms off the overall response time with no loss in functionality. You're welcome! :)
In case you're interested in the raw data, here is a table showing the performance results per test framework and engine task. Times are shown in milliseconds (ms).
| Framework | Instrumentation | Build Task | MSBuild | Analysis Task | Test Execution | Test Task | Full Cycle |
| |
Legacy |
Optimised |
Improvement |
Legacy |
Optimised |
Improvement |
Legacy |
Optimised |
Legacy |
Optimised |
Improvement |
Legacy |
Optimised |
Legacy |
Optimised |
Legacy |
Optimised |
Improvement |
| MSpec |
844 |
119 |
607% |
1611 |
774 |
108% |
442 |
419 |
|
|
|
321 |
323 |
623 |
635 |
2387 |
1544 |
55% |
| MSTest D |
701 |
101 |
593% |
1461 |
829 |
76% |
485 |
459 |
1461 |
829 |
76% |
222 |
216 |
311 |
304 |
2695 |
1924 |
40% |
| MSTest S |
771 |
105 |
636% |
1587 |
830 |
91% |
470 |
469 |
|
|
|
228 |
232 |
619 |
617 |
2351 |
1591 |
48% |
| NUnit2 D |
702 |
101 |
595% |
1407 |
733 |
92% |
431 |
418 |
1407 |
733 |
92% |
191 |
188 |
258 |
262 |
2639 |
1880 |
40% |
| NUnit2 S |
766 |
109 |
603% |
1506 |
789 |
91% |
418 |
418 |
|
|
|
198 |
206 |
709 |
727 |
2409 |
1650 |
46% |
| NUnit3 |
699 |
103 |
577% |
1488 |
710 |
110% |
408 |
398 |
1488 |
710 |
110% |
229 |
228 |
292 |
292 |
2666 |
1859 |
43% |
| Xunit1 D |
692 |
104 |
568% |
1386 |
735 |
89% |
409 |
414 |
1386 |
735 |
89% |
204 |
211 |
276 |
288 |
2828 |
2125 |
33% |
| Xunit1 S |
1157 |
123 |
841% |
1887 |
767 |
146% |
419 |
409 |
|
|
|
614 |
623 |
910 |
922 |
3012 |
1839 |
64% |
| Xunit2 |
686 |
101 |
577% |
1473 |
823 |
79% |
520 |
491 |
1473 |
823 |
79% |
239 |
269 |
316 |
339 |
2717 |
2042 |
33% |
| Average |
780 |
107 |
626% |
1534 |
777 |
98% |
444 |
433 |
1443 |
766 |
88% |
272 |
277 |
479 |
487 |
2634 |
1828 |
44% |
| Total |
7017 |
966 |
626% |
13807 |
6991 |
98% |
4000 |
3893 |
7216 |
3830 |
88% |
2445 |
2496 |
4314 |
4386 |
23705 |
16453 |
44% |
Other Benefits
The newly optimised system also includes a range of compatibility improvements. Most notable here is support for portable PDB files. Previously, we were simply forcing the build system to always output non-portable PDBs. Under the optimised mode, we now allow portable PDBs to be output by the compiler and we will quietly process them in their original form.
We've managed to fix a number of debugger evaluation and inspection problems that were caused by the old system. If you've suffered from any of these issues, it's my hope that you won't see them again.
I'd like to remind you that the new system is still in beta at the moment. Our plan right now is as follows:
1. Release the new optimised mode with V4, available as a configuration setting ('Instrumentation mode') that defaults to the legacy mode. A warning is shown by the engine if you're in legacy mode, asking you to give the new optimised mode a try.
2. In a near future release, once we're more confident in the reliability of the optimised mode, we'll switch it to the default mode of operation. Legacy mode will still be available for anyone experiencing issues with the new mode.
3. Later down the line, we intend to remove the legacy mode from NCrunch entirely. We're hopeful that this will also open some new optimisation opportunities allowing us to push the engine even further.
New Hot Spots Analysis UI
Since its first release, NCrunch has passively collected test performance data on a line-by-line basis. This is shown using the little yellow 'hot spots' overlaying the coverage markers. Over the years we've often been asked if there is another way to view this data to help find bottlenecks in code. We've always wanted to develop such a feature, but it always seemed just out of reach. I'm very happy to say that we've now introduced it in a really big way! V4 introduces the new global 'Hot Spots' window, accessible from the main NCrunch menu.
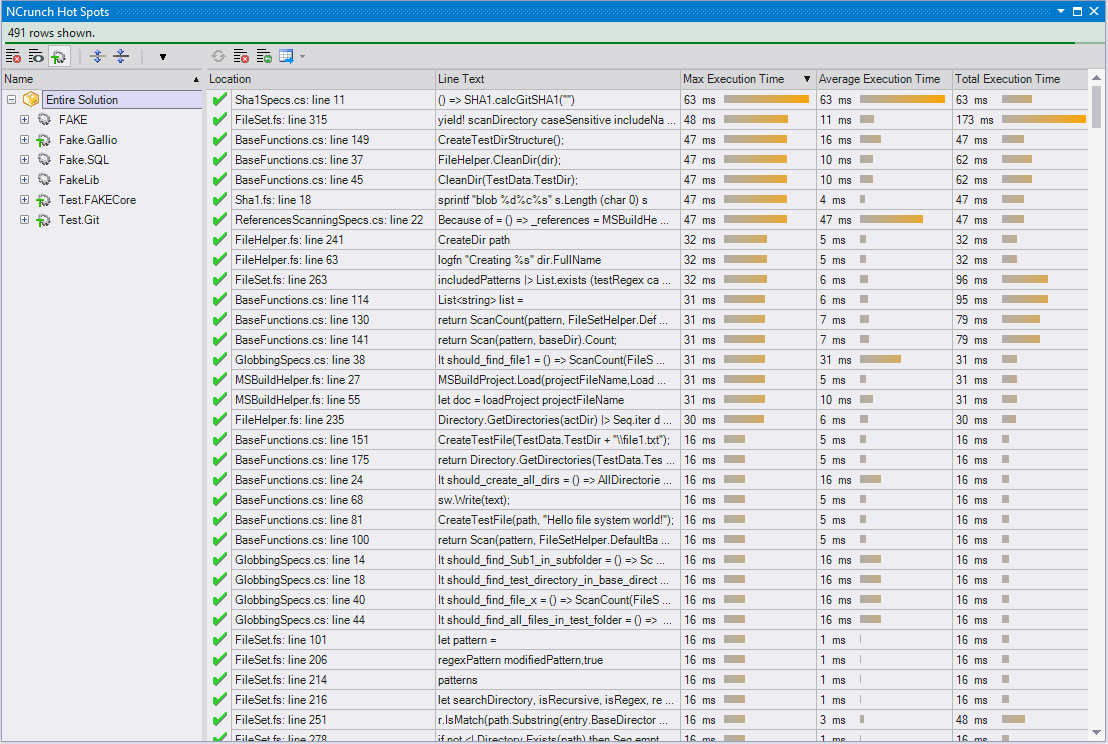
Global Hot Spots View
The global Hot Spots Window shows your solution structure on the left, which can be used for filtering the overall list of source lines shown on the right. It's possible to sort the source lines by any of the main performance metrics we aggregate (max, average, total). Doubleclicking a source line will take you to the code. As in the Metrics Window, it's possible to exclude specific results from the view if they aren't of interest. It's also possible to remove your test projects from the view at the touch of a button in case you're not interested in the performance of the test code.
By default, this window will show the performance results for ALL tests in the solution. However, if you have a coverage filter attached to your engine mode or if you've set the engine to show the coverage results for a specific set of tests, this view will adapt accordingly and will only show the subset. This means you can use it to find bottlenecks not only for the entire suite, but also specific groups of tests.
One of the main complications we encountered when building this window was keeping the data updated. Until now, all parts of the NCrunch UI have been designed to update on-the-fly with no refresh needed. The sheer size of the dataset for this window unfortunately made such an approach impossible, so this is the first part of our UI with a refresh button. When the data is outdated, you'll see a notification at the top advising you to refresh it manually.
If you'd like to sift through data outside NCrunch, there is also an option to export the dataset to text or CSV form.
We also have a new page automatically added to NCrunch's HTML report, which is automatically output from the NCrunch Console Tool, and can be manually exported from the Tests Window option.
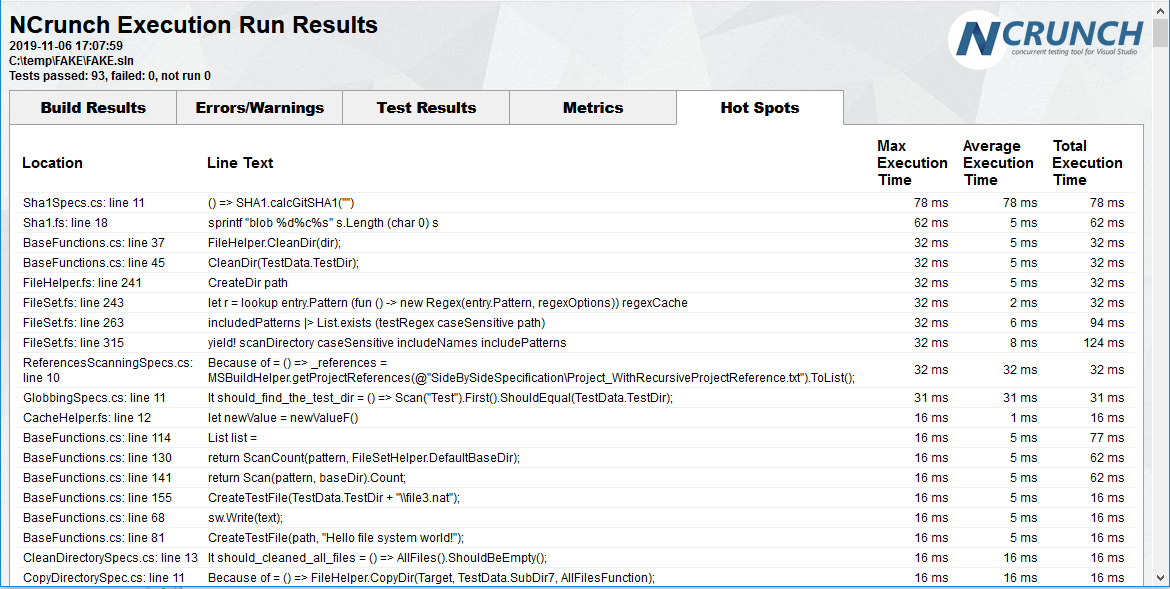
Hot Spots report tab inside the NCrunch HTML Report
This should make it easier to analyse detailed performance information over the build history stored on a CI server.
While dogfooding this feature ourselves, we realised we were using it far more often for tracking the performance of individual tests rather than the entire suite. This led us to extend the feature to also exist inside new tab mounted to the Tests Window.
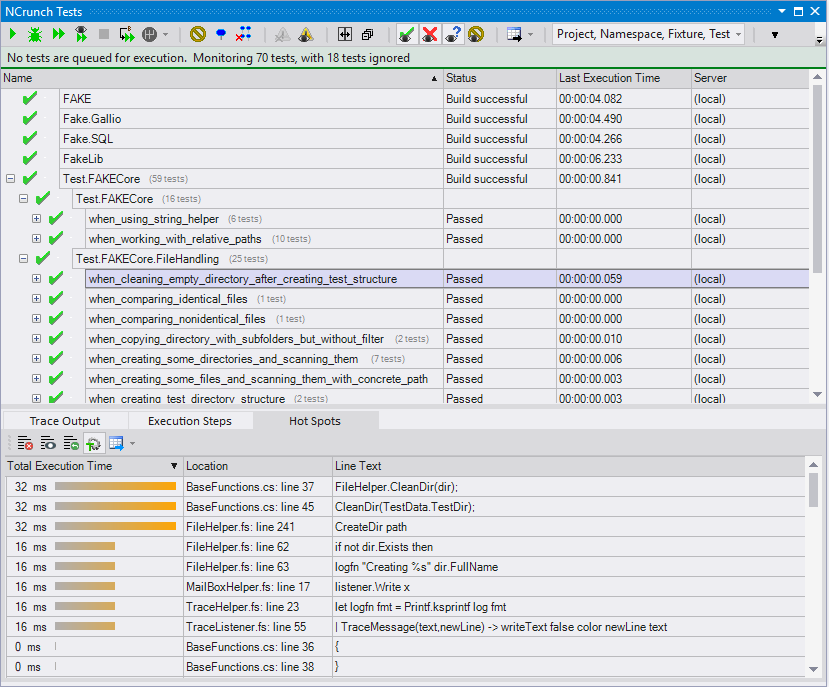
Hot Spots tab inside the NCrunch Tests Window
In the context of the Tests Window, this view functions very much the same as in the global context, but with an implicit filter set to the selected test and no need for a refresh button. The passive collection of this data makes it easy to see exactly what happened the last time a test was run.
More than any other feature we've developed, the utility of this one has surprised me the most. I admit that I'm guilty of often treating metrics as being very much background information while I work on my code. I had expected that the hot spots view would be a niche feature that would be useful in specific situations, but that perhaps I wouldn't be checking very often. I was so wrong. After working with it for a few days, I find I have become extremely reliant on it, to the point where I'm often just leaving it open in the Tests Window while I work. Keeping tests running at an acceptable speed is an important consideration, especially as our codebases get bigger and our CI builds take longer. This feature is a great way to track that performance without needing to go out of our way to measure it.
It has also been quite surprising to me how tracking execution times can often lead to new insight into the behaviour of the system under test. We've unexpectedly found several hidden defects while using this feature ourselves.
Other Stuff
As usual, we've packaged this release with another wave of lesser internal improvements and fixes for reported issues.
After more than 10 years in development, the NCrunch project continues to push the boundaries of automated testing in .NET.
Go grab V4 now and tell us what you think!
 Subscribe